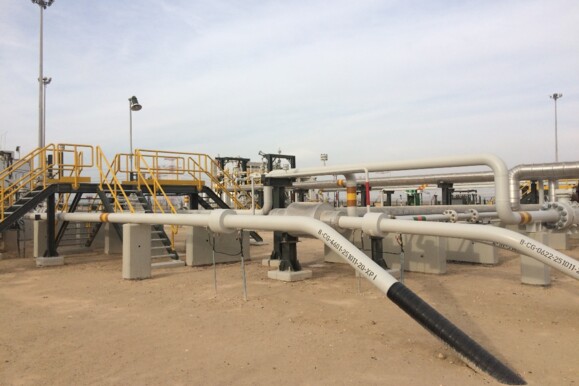
Project Overview
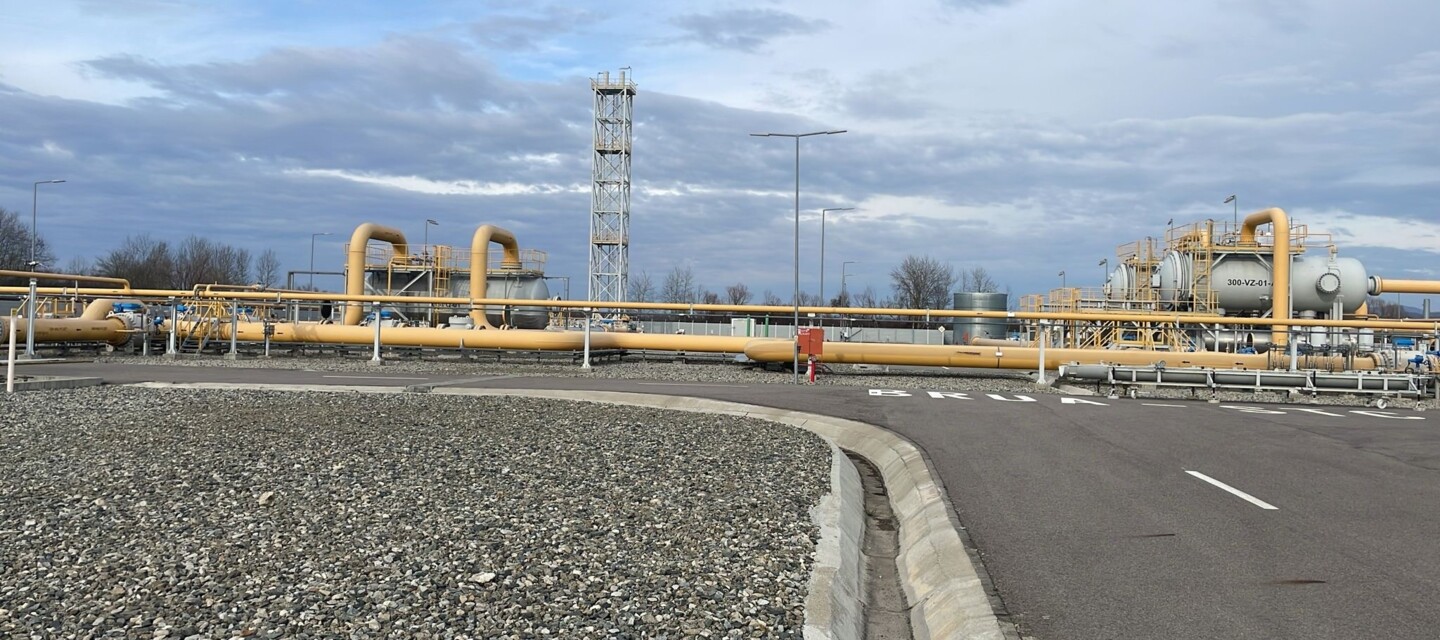
BRUA (Bulgaria – Romania – Hungary – Austria) is a strategic 479 km long natural gas transmission corridor allowing Romania to access natural gas transportation routes from the Caspian Sea to Central Europe and facilitating the exploitation of additional gas resources in the Black Sea.
The pipeline has a diameter of 32” and a design pressure of 63 bar. It includes a fiber optic cable (FOC) laid along the pipeline for communication and monitoring purposes.
Completed in 2020, the BRUA pipeline section in Romania is routed in areas with considerable construction and agricultural activities in addition to a threat of landslides in some areas. To detect potentially harmful third-party intrusion (TPI) activities near the buried pipeline, as well as possible gas leaks, the operator requested the deployment of a fiber optic–based Distributed Acoustic Sensing (DAS) system. This allows maintenance teams to respond quickly in case of any threat.
Solution
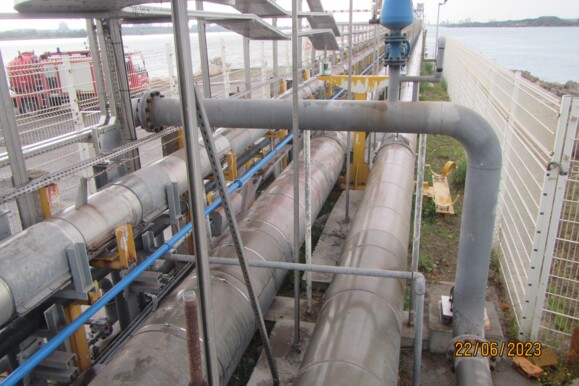
The monitoring solution consists of 10 single channel N5200A DAS instruments with measuring ranges of 50 km and 70 km depending on the distance between the valve stations. Each of the systems is connected to a dedicated single-mode fiber within the FOC , which is installed in a duct and placed at the 2 o’clock position within a distance of approximately 30 cm from the pipeline wall. All sensing instruments are mounted in standard 19” cabinets which are located in ten substations along the pipeline. Two separate servers with the main operator interface SmartVision are configured to visualize and send the alarm information to SCADA. Figure 1 illustrates the pipeline and FOC duct during the installation phase and a monitoring cabinet in one of the valve stations.
The DAS solution is configured to monitor the entire pipeline system in real time, visualize the acoustic energy over time/distance in waterfall plots, store the measured data on internal disks, and trigger an alarm in the event of a risk. The alarm notification includes information about the type, time, and location of the threat. While detection of TPI events relies on identification of large-magnitude, low-frequency vibrations generated in the ground, the classifier of leak events rests on capturing of high-frequency signals in combination with a temperature change that can be measured by the inherent Distributed Temperature Gradient Sensing (DTGS) technique. In the occurrence of a gas leak, it is expected that a pressure of 63 bar generates a cold spot with a relevant negative temperature change as a consequence of the Joule-Thomson effect.
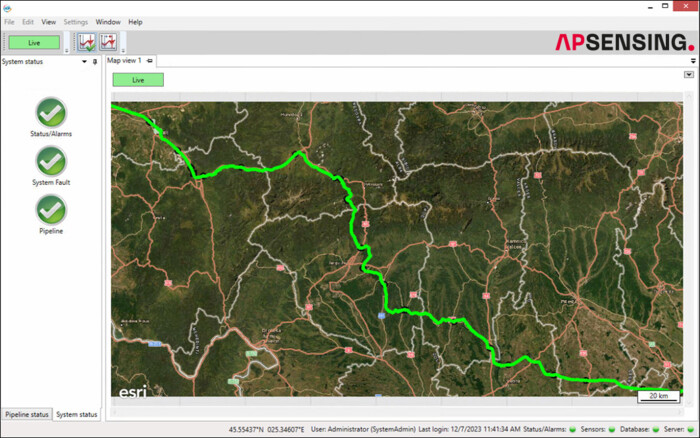
The alarm notification is visualized on AP Sensing’s monitoring platform SmartVision (see Figure 2) and forwarded to the SCADA system via IEC-60870-5-104 protocol. In the case of TPI, gas leak, or fiber break events, the location is highlighted on the map view of SmartVision , and a notification with the event type, time stamp, duration, fiber/ pipeline position, GPS coordinates, and nearest landmark is shown.
Results
In order to simulate real potential threats as part of the Site Acceptance Testing (SAT) procedure, machinery digging tests were conducted at different locations within a distance of a few meters from the pipeline. Figure 3 shows an example of one of the excavator tests including the waterfall diagram of the DAS system and the alarm notification in SmartVision . The signal imprint could be classified correctly by the DAS algorithms, and the location of the activity could be indicated accurately on the map including the pipeline position and GPS coordinates.
Pipeline Inspection Gauge (PIG) tracking is also a feature offered inherently by the DAS system . During the inspecting and cleaning process of the pipeline, the PIG generates in general strong vibrations which are captured by the FOC installed along the pipeline and measured by the DAS system . The vibrations give then an insight into the position and speed of the PIG in real time. Especially in the case of obstructions e.g. due to debris or mechanical damage, the PIG may get stuck, and the latest position can be obtained based on the DAS system . This mitigates the risk of losing the PIG and helps the operator to localize the position of the artefact. In the meantime, several PIGging campaigns have been executed for the BRUA pipeline based on utility and geometry inspection PIGs. With the help of AP Sensing’s DAS systems , the campaigns could be monitored successfully.
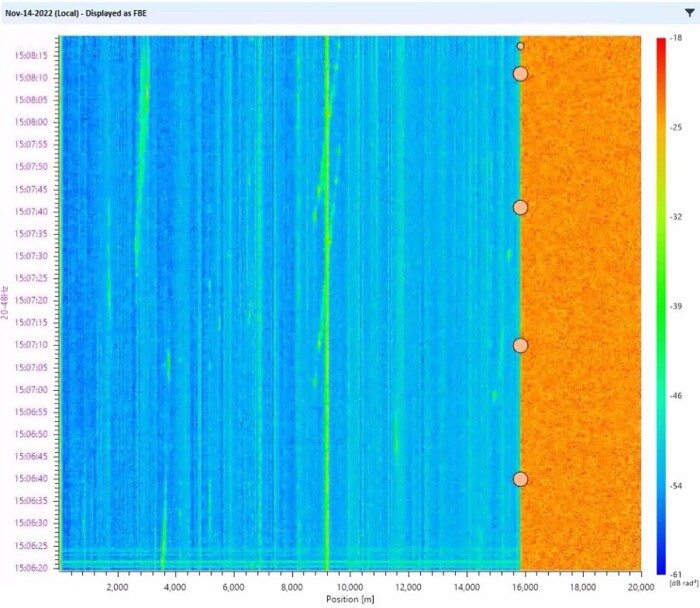
Figure 4 illustrates a scrapper used prior to the instrumented PIG campaign. The waterfall diagram shows the signal imprint of the PIG, moving at approx. 10-12 km/h and generating pressure waves travelling at a velocity of 430-450 m/s.
During commissioning, a fiber-to-asset mapping process was carried out along the entire 479 km route to eliminate discrepancies between the fiber and pipeline lengths. This calibration improved event localization accuracy to approximately the gauge length of the 70 km system. An example of a fiber break encountered during the commissioning phase is shown in Figure 5. It is worth mentioning that the DAS system still offers continuous monitoring of the asset until the fiber break location.
Building on the successful performance of the installed systems, the BRUA corridor is now being extended with a new 310 km pipeline connection to the Black Sea. Six additional DAS systems from AP Sensing are being commissioned as part of this expansion. Once completed, the combined monitoring solution will cover roughly 800 km of critical pipeline infrastructure, one of the most extensive DFOS deployments worldwide and a clear reflection of the operator’s confidence in AP Sensing’s technology.
Conclusion
The implementation of AP Sensing’s DAS monitoring systems has proven to be an efficient solution for TPI events detection and PIG tracking in pipeline applications. In fact, since commissioning of the solution, several real activities near the pipeline have been correctly detected.
Additionally, potential fiber breaks due to landslides could be localized accurately, offering another tool for the maintenance team to save time and react promptly.
Moreover, pipeline cleaning and inspection processes used the ability of the DAS systems to provide valuable information about the position and real-time velocity of PIGs at each position during the entire campaign.
