SmartVision
 AP Sensing’s SmartVision software takes the guesswork out of data analysis. It collects and integrates monitoring data across multiple devices and technologies such as Distributed Temperature Sensing (DTS), Distributed Acoustic Sensing (DAS), Distributed Vibration Sensing (DVS), CCTV cameras and other sensors.
This data management and analysis program provides a schematic asset visualization for easy orientation, and the current status of all configured instruments. In the case of a critical event, personnel is informed directly through the system and can react accordingly with the necessary emergency measures to minimize downtime.
SmartVision stores recorded information in a central database and makes this data available for analysis, reporting and export. The data is accessible to multiple users and from multiple locations. Points of interest can be analyzed with historic trend analysis, and historical data is always available.
How SmartVision operates
Our AP Sensing software is highly reliable and uses stringent re-validation methods to constantly verify that the safety features are functioning properly. Powerful alarm algorithms keep operators informed of all alarm conditions with a clear, intuitive graphical user interface (GUI). Personnel who are responsible for emergency situations need an immediate and accurate overview by looking at a single screen. With SmartVision software, operators can see where threats are located and derive valuable information that assists in making informed decisions.
SmartVision can be used for a various applications:
For Fire and Heat Detection, SmartVision provides schematic asset visualization for quick orientation and the status of all configured Linear Heat Detection (LHD) instruments. All zone and alarm statuses come directly from the LHD instrument(s), no software programming or configuring is necessary. Because the LHD instruments are already configured to comply with the necessary fire safety standards, this also ensures that SmartVision complies. Each section of the sensor cable deployment is color-coded for quick visual detection according to the real-time temperature of your asset.
For Pipeline Condition Monitoring, sub-sections of the pipeline route can be flexibly defined for different thermal and acoustic alarm criteria, to signal in case of pipeline leakages, third party intrusion (TPI) activities or other events threatening the pipeline integrity. Each section of an asset is color-coded for quick visual detection according to the real-time condition of a pipeline. Points of interest, such as valve stations, manholes and horizontal drillings, can be analyzed with historical trend analysis.
For Power Cable Monitoring with DTS instruments, SmartVision automatically detects hotspots, provides alarms if critical limits are exceeded and creates accurate temperature profiles. A Real Time Thermal Rating (RTTR) engine is incorporated into the software to calculate conductor temperatures and ampacity levels as well as perform transient calculations for emergency situations. For DAS, SmartVision automatically displays acoustic events from multiple instruments, e.g. third party intrusion (TPI) events or cable faults, and provides information including the location. Operators can see where the bottlenecks are and derive valuable information that assists in making informed decisions for future power grid designs and upgrades. Sub-sections of the cable route can be flexibly defined for different thermal and acoustic alarm criteria. Each section of the circuit is color-coded for quick visual detection according to the real-time condition of your cable asset.
For the special conditions of subsea cables, we offer a Burial Depth Module. The Burial Depth Module identifies changes in burial depth of subsea cables for all positions along the length of the cable. This can help operators to realize significant cost savings, detect exposed cables and take countermeasures.
Easy Data Integration into Existing Systems
This asset visualization software integrates easily into your existing management platform and communicates directly over standard Ethernet protocols. Various protocol interfaces such as Modbus TCP, IEC 60870-5-104, IEC 61850 or DNP3 can be part of the SmartVision package for seamless SCADA integration and transmit the results directly to your management system.
SmartVision provides different modules to present the best overview of information needed for your application:
Asset View
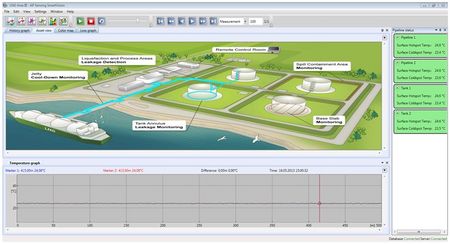
- Sensor cable routing is schematically displayed as color-coded lines in a customizable diagram
- Transfers highly complex information to quickly detectible representations

- Fiber-to-infrastructure mapping and definition of asset zones (non-linear fiber-mappings)
- Pinpoint to the location(s) of alarming
- Incorporate landmarks along the route (e.g. joints, manholes, HDD, and splice locations)
- Integrate CCTV cameras
- When an alarm is generated, the corresponding camera can be controlled in its pan-tilt-zoom (PZT) functions
- Movie function (view and analyze historic developments and events)
- Live and analysis view modes; analysis mode allows deeper analysis of a defined area while live monitoring continues
Map View
- For enhanced visualization compared to schematic asset visualization:
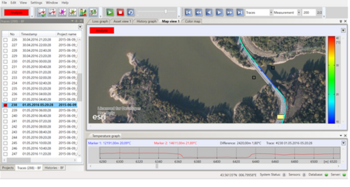
- Representation of the asset based on geospatial coordinates
- Different map sources (satellite, streets, topographic)
- Color-coded asset temperature visualization
- Loss-free zooming, static rotation, move the map as needed.
- Online maps and offline maps (for sites without permanent internet access)
Insight View
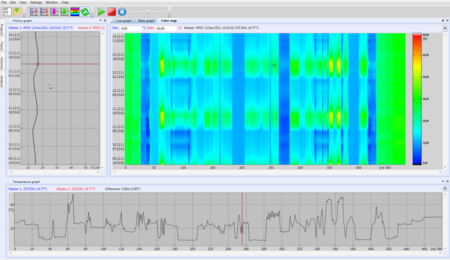
- Any combination of time, distance and temperature can be displayed

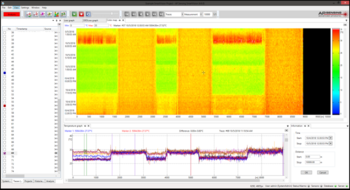
- 2D color maps and multi trace analysis
- Additional data (e.g. from electrical sensor) can be displayed time synchronized on a second axis
- Analysis of point or area of interest (e.g. development over time)
- Movie function (view and analyze historic developments and events)