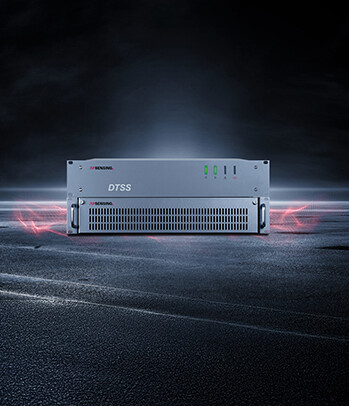
One 1-channel AP Sensing Linear Power Series device measures the 25 km underground circuit with a singlemode optical fiber for continuous temperature measurements. The circuit load is recorded by the AP Sensing Multisensor Board's analog inputs and then shared with the SmartVision™ data management and asset visualization software.
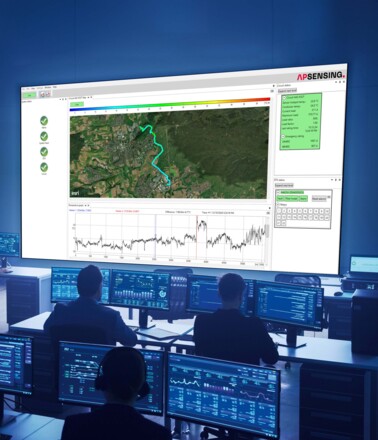
AP Sensing’s SmartVision™ software suite automatically detects multiple hotspot locations, issues alarms if pre-defined temperature limits are exceeded and creates temperature profiles in an SQL database for post processing and analysis.
The asset viewer delivers color-coded circuit monitoring status to the operators and network planners. This fiber-to-the-infrastructure mapping lets the operators pinpoint the exact alarm locations and place landmark symbols along the route, such as joints and splice locations.
In addition, when in Map View, the map can now be zoomed in and out, providing a resolution up to 1:5000 to show even greater detail, including street names. GPS coordinates are used to map the circuit route itself for maximum viewer accuracy.
The buried circuit travels through 14 different types of subsoil conditions.
To reduce the on-site installation and commissioning time, AP Sensing delivered the system fully integrated into a system cabinet, which is located in a protected control room.